A Little Green Does the Body Good

We think that health maps do not only consist of physical health, but also mental! If you are living in the concrete jungle, and although it is beautiful in it’s own unique way, maybe you want to be surrounded by more nature.

I found this cool and informational map by Hana Alberts on ny.curbed.com that shows 40 gardens, parks, and green spaces in NYC that you might not know about! Instead of making the trip to Central Park, check out one of these cool spaces. Go to ny.curbed.com or click here to view the map and website! Thanks Curbed!

Screen Shot 2016-06-07 at 12.37.17 PM.png

Climate Change- How Sea Level Rise Could Change Where & How We Live

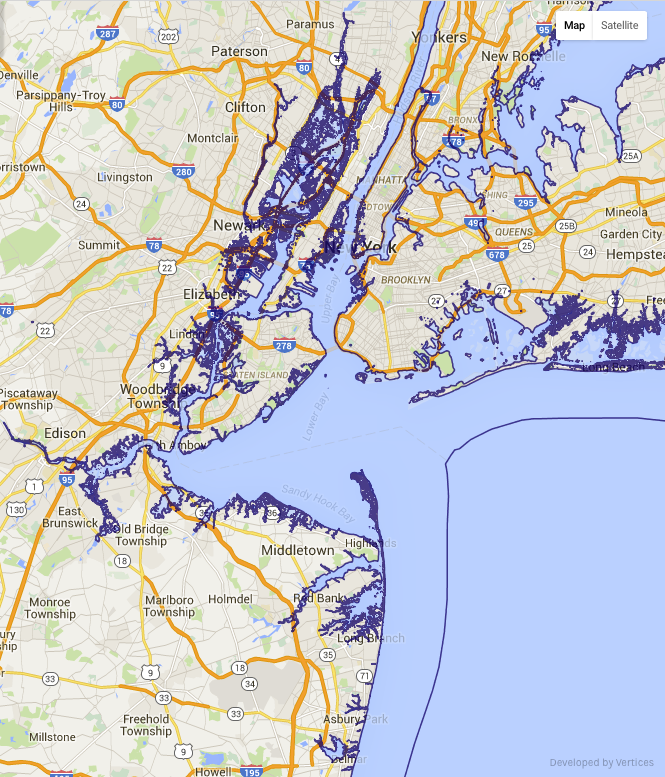
Climate change is always a hot topic, literally. With the melting of the ice caps, the unstable polar vortex which influences the jet stream, and with temperatures becoming more extreme, it is no mystery that sea level is continuing to rise. We wanted to visualize the threat of sea level rise by making a map that shows the potential projections of how our coasts in New Jersey and New York could eventual look.

nyc 1   nyc2   nyc3
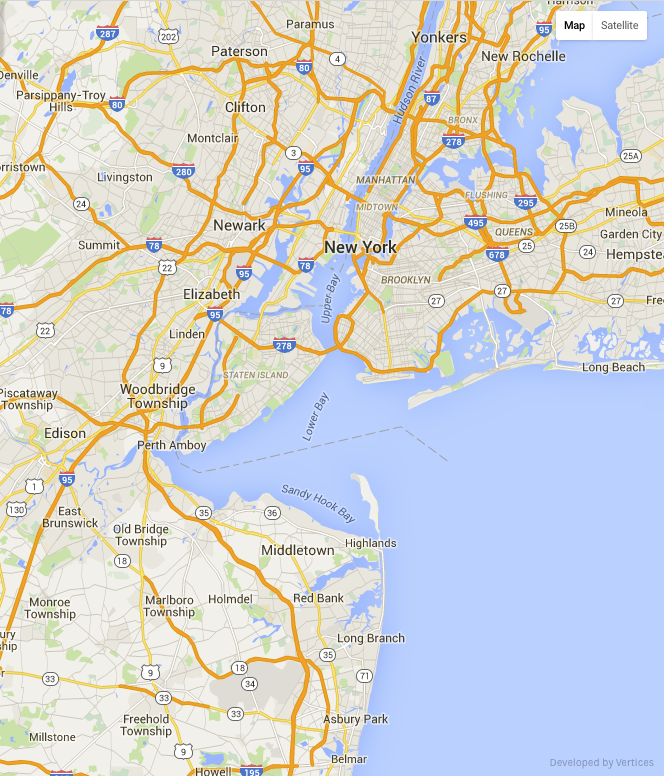
We zoomed in to focus on New York City and the Northeastern part of the New Jersey coastline. We gathered the information for sea level rise from usgs.gov and then created the map using our Mappler technology. The first image is what the coast currently looks like, with the second and third images showing possible sea level rise projections. Image 2 shows sea level rise projections for 2100 if climate change continues without us taking action. This projection shows a 2m rise, with the dark blue border showing the potential new coastline. Image 3 is the worse case scenario for the year 2100, meaning that this is what scientists are projecting if again no action towards stopping or slowing climate change takes place and if the Greenland ice sheet melts. Image 3 shows a 7m sea level rise, and as you can see the land taken is massive. These maps show the scary reality that we could face if climate change is not taken seriously. You think that the population and its growth are bad now? How about when we then have to face displacement of part of the population because land where they use to live is covered in water? Take action, educate on climate change, and do your part!

To see the map and view more of the NJ and NY coast projections click here!

Happy Earth Day! NYC Tree Map

Trees help city areas with reducing pollution, they help to improve health, and overall bring a sense of calm to a place known for fast-pace living. Here is a map we created on Mappler using data from the TreesCount! 2015 by the NYC Department of Parks and Recreation. This map is color-coded based on condition of the trees. 

Screen Shot 2016-04-22 at 3.19.44 PM.png

Looking at the density screenshot, it is interesting to view where the best versus worst rated trees are located. The photo on the left shows where the worst rated trees are, and the right shows the trees rated as the best. Lets keep adding trees to our concrete jungle! Click here to see the site.

Good_Trees.PNG      Poor_Trees.PNG

EIA- U.S. Energy Mapping System

Energy maps are one of my favorite maps to look at, mainly because I think it is great seeing how the US is making steps towards clean, renewable energy. Here is a map that I found on eia.gov that shows all of the energy mapping systems in the US, from clean green energy to fossil fuels. I decided to show only the renewable energy sources on this post, consisting of biomass power plants, geothermal power plants, hydroelectric power plants, pumped storage plants, solar power plants, wind power plants, and wood power plants. On the site you can also look at the fossil fuel sites, transport and storage sites, market hubs, and administrative boundaries. Check out the map and see what is in your area! Is your area a place of more renewable clean sources, or a place that still needs to make the change? Thanks EIA for this great map!

Screen Shot 2015-10-05 at 9.47.59 PM

All information and photo from eia.gov

Click here to see the site. Contact gis@vertices.com